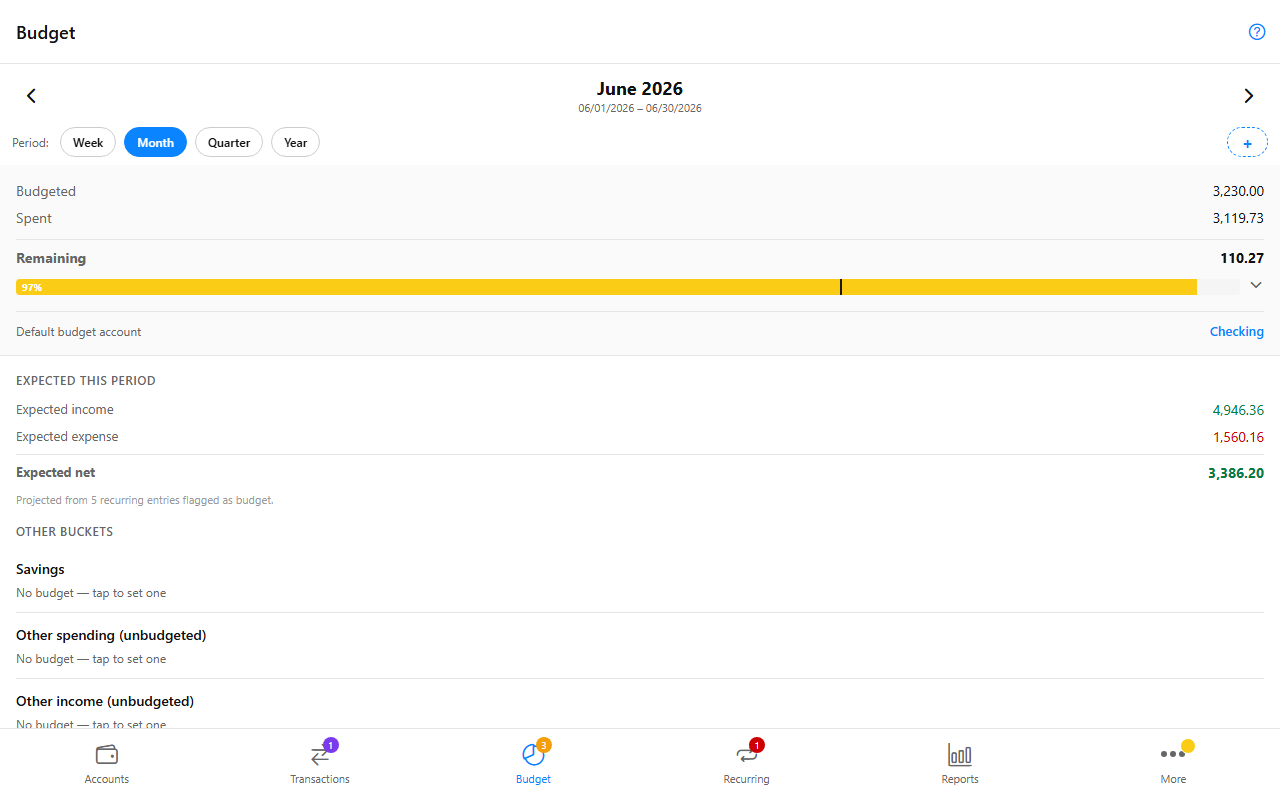
Budget
Per-month envelope view of your spending. Each row is a category with a budgeted amount; the bar shows actual-vs-budget for the active window.
Reading the bar
- Cyan — on pace (spending below the prorated daily target).
- Yellow — close to limit (above prorated but still under
budget).
- Orange — over budget for the window.
The thin vertical mark on each bar is today's prorated target — a straight-line projection of where you'd be if you spent uniformly through the window.
Time window
The chip row at the top picks the window:
- Week / Month / Quarter / Year — fixed
cadences. The chevron buttons step prev / next by one window.
- Custom — reveals a date-pair picker below the chips.
Summary card
Shows the totals for the active window: budgeted, spent, remaining, with the same pacing colour as the per-row bars. When a default budget account is set on App Settings, its name appears here too — the budget bar pulls its actuals from that account only.
Income / expense subtotals
Two grouping rows split the per-category rows above and below. Each carries its own totals for the window.
Per-category rows
One row per category with a budgeted amount. Tap to open the per-category editor + the BvA chart. Categories with no budget land in Extra spending at the bottom.
Tips
- The monthly bar at the top sums the per-category figures, so
it inherits the same pacing-colour logic.
- Pull-to-refresh re-reads from the DB if you've edited
transactions on another tab.